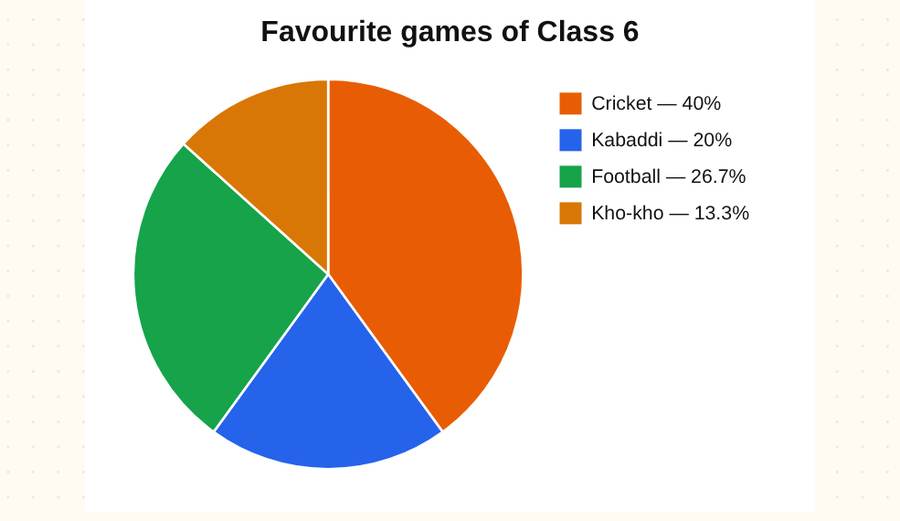
Pie chart and bar graph maker · पाई चार्ट और दंड आलेख
Type your data (one item per line), choose pie chart or bar graph, then print it or download it as a picture for your project. Nothing is sent anywhere.
How a pie chart works
The whole circle is 360° (100%). Each slice = (value ÷ total) × 360°. Example: Cricket 12 of 30 → 12/30 × 360° = 144° (40%).
Bar graph tips
- Bars have equal width and equal gaps.
- Choose a scale (1 unit = 2 children…) and label both axes.
Practise reading graphs: pictographs · mean, median, mode.
For Class 4 to 10 (data handling) and school projects.