Statistics: grouped data · सांख्यिकी: वर्गीकृत आँकड़े
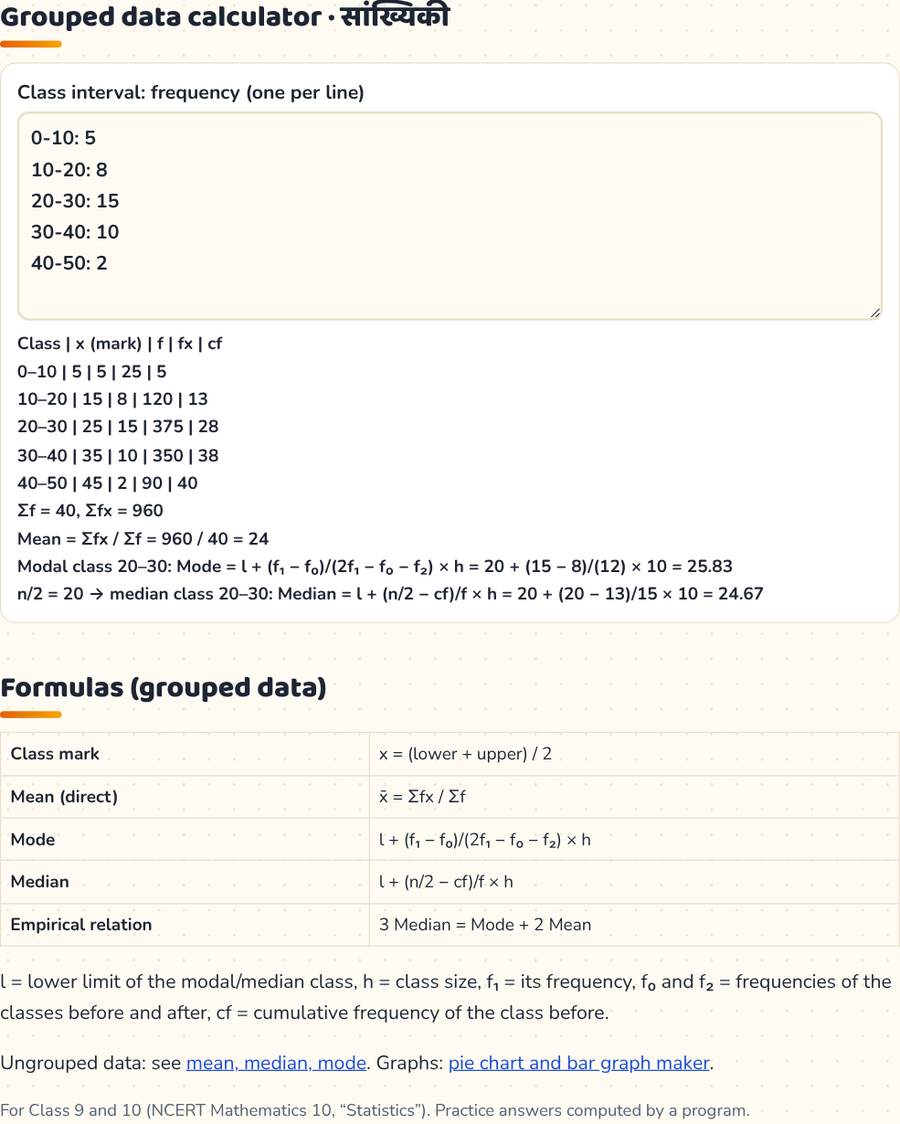
Type the table — get mean, median and mode with every step.
Statistics: grouped data games
Grouped data calculator · सांख्यिकी
Formulas (grouped data)
| Class mark | x = (lower + upper) / 2 |
|---|---|
| Mean (direct) | x̄ = Σfx / Σf |
| Mode | l + (f₁ − f₀)/(2f₁ − f₀ − f₂) × h |
| Median | l + (n/2 − cf)/f × h |
| Empirical relation | 3 Median = Mode + 2 Mean |
l = lower limit of the modal/median class, h = class size, f₁ = its frequency, f₀ and f₂ = frequencies of the classes before and after, cf = cumulative frequency of the class before.
Ungrouped data: see mean, median, mode. Graphs: pie chart and bar graph maker.
For Class 9 and 10 (NCERT Mathematics 10, “Statistics”). Practice answers computed by a program.
A one-page chart to stick on the wall, and a worksheet to practise.
Statistics — grouped data
Mean Σfx/Σf · Mode l + (f₁−f₀)/(2f₁−f₀−f₂)×h · Median l + (n/2−cf)/f×h · 3 Median = Mode + 2 Mean
kheloaurseekho.in — free charts, games and worksheets
Statistics — worksheet
Name: ____________________ Class: ______ Date: __________
1. Find the mean: 0–10: 4, 10–20: 6, 20–30: 10, 30–40: 5
2. Find the modal class and mode of the same data.
3. Find the median of the same data.
4. Draw a cumulative frequency table for it.
kheloaurseekho.in — free charts, games and worksheets